Are LLMs not getting better?

I was reading the metr article on how llm code passes test much more often than it is of mergeable quality. They look at the performance of llms doing programming when the success criterion is “passes all tests” and compare it to when the success criterion is “would get approved by the maintainer”. Unsurprisingly, llm performance is much worse under the more stringent success criterion. Their 50 % success horizon moves from 50 minutes down to 8 minutes.
As part of this they have included figures such as this one:
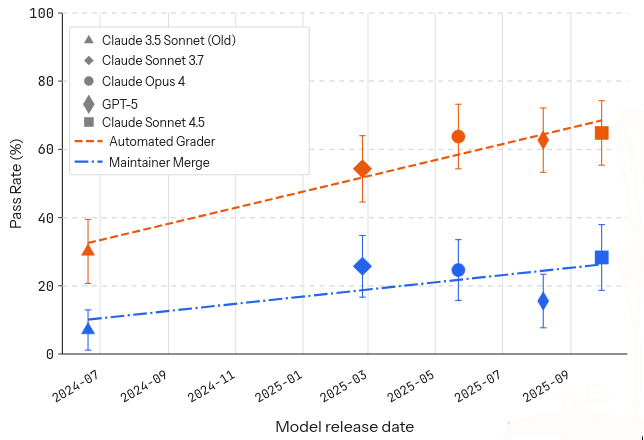
But there’s something about it that strikes me as odd. Let’s look only at the more valuable data, the merge rates.
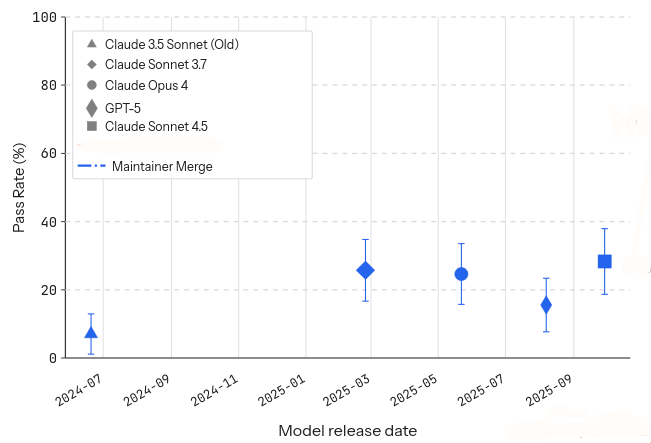
What line best characterises this data? metr suggested something that slopes slightly upwards. But here’s what I see:
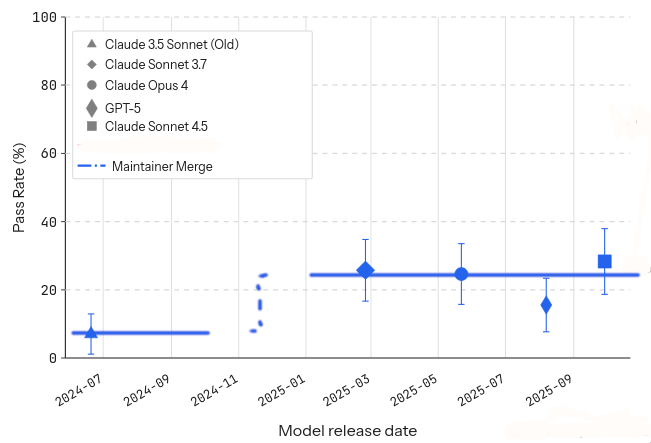
At some point toward the end of 2024 we may have had a step up in ability, but this plot shows no evidence of any actual improvement in merge rates since early 2025.
Fisher warns us against eyeballing plots, so let’s make it more formal. We’ll use leave-one-out cross-validation and compare the linear slope suggested by metr against the step function the plot hints at.
| Model | Brier score |
|---|---|
| Gentle upward slope | 0.0129 |
| Piecewise constant | 0.0117 |
The Brier score is a form of squared error, thus lower is better. This means the step function has more predictive power (“fits better”) than the linear slope. For fun, we can also fit a function that is completely constant across the entire timespan. That happens to get the best Brier score.
| Model | Brier score |
|---|---|
| Gentle upward slope | 0.0129 |
| Piecewise constant | 0.0117 |
| Constant function | 0.0100 |
Stop and think about what this means: the two models that predict constant merge rates over the latter half of the plot are more accurate than the linear growth trend.1 And more accurate than a logistic trend, since linear in log-odds is nearly linear in probability for this range of values. This corroborates what we eyeballed in the plots: the merge rate has not increased in the latter half of this plot.
This means llms have not improved in their programming abilities for over a year. Isn’t that wild? Why is nobody talking about this?
Post scriptum: I have heard claims that in the four months between the end of the metr plot and today there has been another step in capability (with newer Anthropic and Google models), but we have no clear evidence of that, because nobody has measured merge rates as carefully as metr has for the models past Sonnet 4.5.
There may have been a clear step up in capability. But on the other hand, people made the same claim throughout 2025 as well, and as we see now, it wasn’t true then. During 2025, the gap between buzz and actual performance was larger than we thought. Is the same true now? I don’t know. But that’s what I find interesting.