Weather Forecasts Are Punctuated
If you care at all about the weather, and you are not using probalistic weather forecasts, you are doing yourself a disservice. The ecmwf provides them to the public for free, although in a slightly awkward format. Use the “select dimensions” button to change to your location.
How to read probabilistic weather forecasts
To learn to read these images, it helps to switch to the “15 days ensgrams” under “Meteogram type” because it has less going on. Here’s an example of what it might look like.
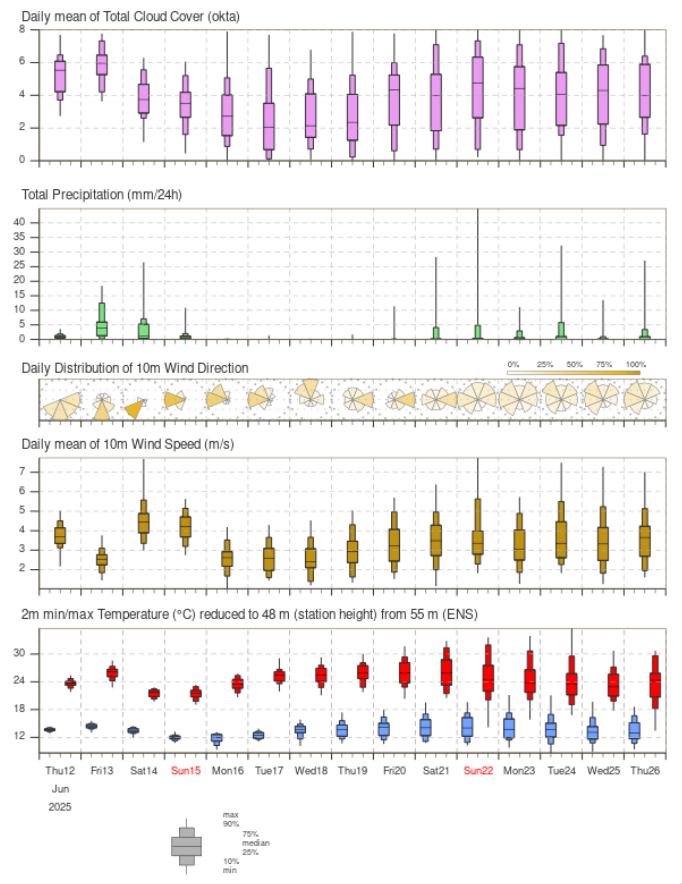
When the meteorologists at ecmwf simulate the weather, they track how the values of some parameters1 For this discussion, cloud cover, precipitation, wind direction, wind speed, and temperature. evolve over time. The weather is a chaotic system, so they run many of these simulations, and thus, for each day, they get many possible outcomes for each parameter. These outcomes are plotted in the respective panels.
By looking at a probabilistic forecast like this one, we can learn not just that the high temperature at this location on Thursday is going to be 24 °C, but that it’s fairly certain to be nearly exactly 24 °C. This is in contrast to something like cloud cover, which is harder to forecast: we know it’s not going to be fully overcast all day, and know it’s not going to be fully clear for more than half of the day, but other than that, we cannot say very much other than that we’re likely to have broken clouds throughout the day.
We can also see a typical feature of probabilistic forecasts: rain correlates with maximum temperature. On days where the amount of rain is uncertain, we also tend to see greater uncertainty in maximum temperature. This makes sense, but I had never thought about it before looking at probabilistic weather forecasts.
Getting more detailed precipitation information
Note that we cannot tell the amount or type of precipitation from this diagram. For this purpose, the ecmwf publishes a precipitation type meteogram. This tells us, in rough bins, the amount and type of precipitation forecast, as well as how likely that combination is, split up into three-hour intervals.
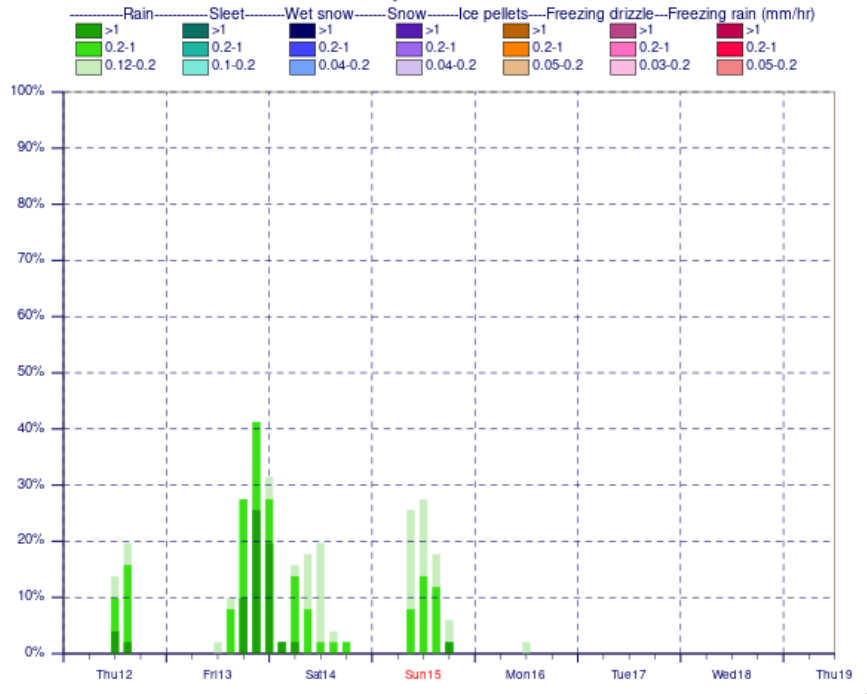
This says that the last three hours of Friday night has a 40 % risk of rain, and if it falls, it’s going to be at least 0.2 mm over that three-hour period.
Of course, these three-hour periods are not independent, so we cannot conclude that the risk of rain on Friday is 62 %. What we can do is take a magnifying glass to the 15-day meteogram precipitation panel, and estimate the area of the box plot that is above zero. There is at least a 75 % probability that there is some amount of rain falling that day. The precipitation type meteogram indicates that it’s almost guaranteed to fall in the second half of the day, if it does.
Uncertainty increasing toward climatic average
We can see on the 15-day meteogram that the uncertainty of the forecast increases as the time frame increases. On the second Saturday, the maximum temperature covers a fairly large span of possibilities. Even if a (dumbed-down) non-probabilistic forecast says the maximum temperature next Saturday is going to be 24 °C, we can tell from the probabilistic forecast that it could very well be as low as 19 °C, or over 30 °C.
At some point, not very far into the future, the uncertainty of the forecast grows so large that we might as well look at long-term averages instead. If we switch the meteogram type to “15 days ensgrams with Climate” we’ll get the long-term statistics in the background, behind the forecast.
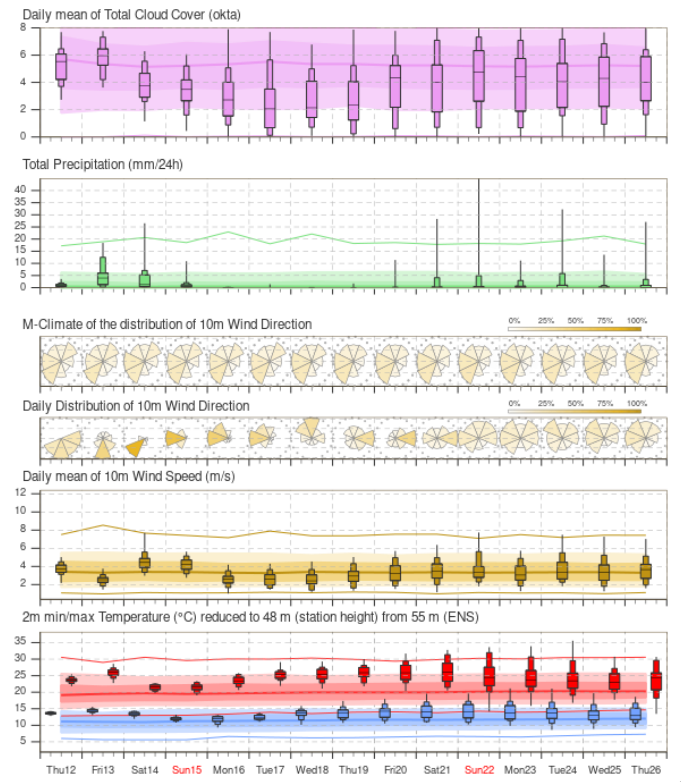
We see that throughout the entire 15-day period, the temperature forecasts – despite their uncertainty – remain slightly different from what’s typical based on long-term statistics: this location is unusually warm for this time of year. However, the wind speed forecast practically converges on the long-term statistics around the second Friday or so, meaning any forecast around wind speed is meaningless after Friday, because we could just as well look at long-term averages.
Uncertainty comes suddenly
Now, I thought that was the end of that. Forecasts are meaningful indicators for a few days out, then after that, long-term averages are just as good. However, the point where long-term averages take over isn’t a fixed time into the future.
Here’s the forecast for a location I went to to for a yearly meet-up with my international colleagues.
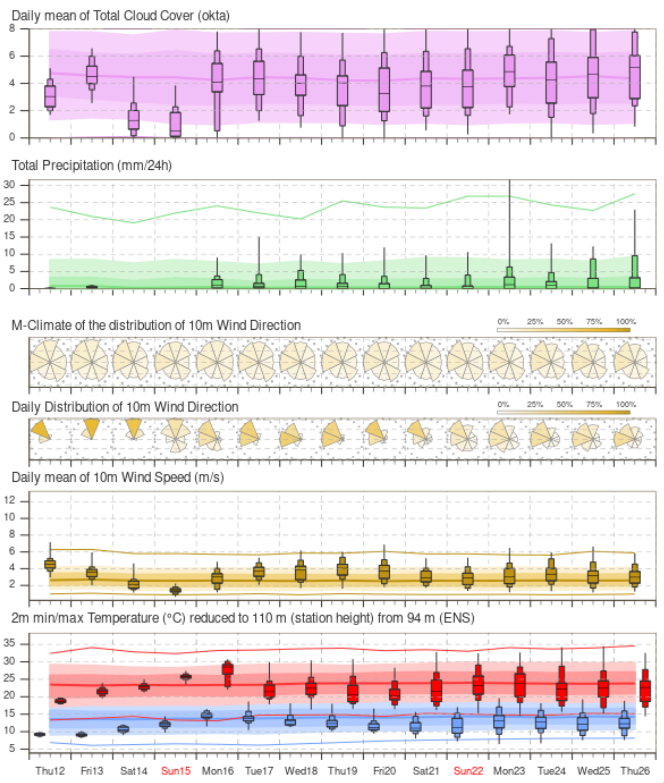
The forecast is very specific for the first four days: temperatures are certain to increase, wind speed is certain to decrease, there is little or no rain, and there is a usable cloud cover forecast. But then on the fifth day, everything becomes uncertain. There is something that happens in the weather specifically around that day that causes the simulation outcomes to spread out. Whatever it is that happens, it acts as a wall to knowledge about the future. We can see with great precision before it, but we don’t know much about what happens after it.
My weather-fu is too weak to know what that something is. By looking at geographical forecasts, I can see that there’s a rain front approaching the location in question and then maybe breaking apart before it reaches it, or just after it reaches it. I assume the point of breaking apart determines the weather to a great deal, and knowing that point exactly is difficult.
The point is that this is not uncommon. Every now and then when I study the weather forecast in greater detail (before vacations, picnics, etc.), there’s one of these knowledge walls a few days into the future. That seems like useful knowledge to me: it’s the weather saying plan this far, but no further. Why do people not talk about this?